Moodle’s analytics tools help with student guidance

Article sections
Learning analytics helps in teaching planning, student guidance and implementation development. There is a lot of information, the most important thing is to identify the most relevant information that supports the pedagogical model chosen for implementation.
The teacher can view the activities of the members of the workspace using various logs and statistics. The various options for reporting offer the opportunity for a detailed examination of the students’ activities or overviews, which benefit the teacher also in the further development of implementations.
Participants list
In Moodle’s “Participants” list, you can see when the student last visited the Moodle workspace.
- You can use this feature e.g. when you want to find out the student’s activity: whether the student visited the course area 2 weeks ago or 2 hours ago.
- By clicking on the participant’s name, you can view a summary of the activity related to the participant’s workspace, e.g. full report.
Reports
Reports are part of Moodle’s standard functions. The reports accumulate implementation-time data per workspace. Reports functionality can be found in Moodle in the workspace management menu:
- open the workspace management menu by pressing the wheel in the right corner of the workspace name.
- select “More…”
- open the Reports tab.
| Function | Purpose of use | Example |
| Logs | Examines the events of an individual student or activity. | You can view the student’s activity for guidance.
You can follow the work in the course area in real-time. |
| Live logs | kuuluu kaikkien osallistujien tekemiset tunnin aikana, tieto päivittyy kerran minuutissa. | Voit käyttää materiaalien käyttöä työtilassa. |
| Activity report | Shows a summary of the viewing statistics of all activities and materials at a general level. | You can send a message to students who have not returned the assignment: click the checkbox next to the students and send the message to the selected users. |
| Course participation | Shows information according to activity, time and user. | You can follow the progress of the entire group or individual students in one table. |
| Activity completion | This function requires that performance monitoring is turned on and monitoring conditions have been defined for individual activities.
Shows a summary of the activities and materials set to be followed by all students. |
You get an overview of when work has been most active. |
| Statistics | Shows work activity as a line graph, you can select the time period you want to view. | You can use the information to plan future implementations or to organize guidance sessions. |
Heatmap
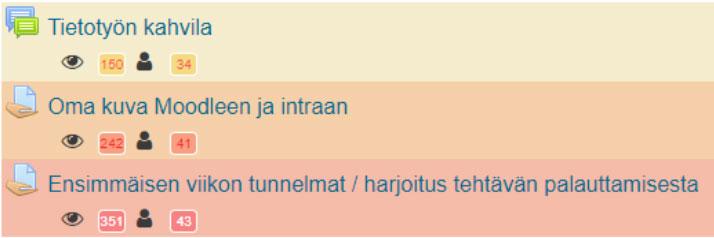
The heat map shows the usage amounts of different activities and materials directly on the front page of the workspace. You can see at a glance how much of any activity or material has been used. The information is shown in both colors and numbers (number of openings/students): the darker the color, the more active the activity. If the grid format is used in the workspace, you need to open a single section of the workspace to view the results.
The heatmap view can be shown/hidden as needed by pressing the Show/hide heatmap text in the block.
Analytics Graphs
- Analytics Graphs are a block visible to the teacher, which is specific to the workspace. The block collects the data in the workspace and visualizes it. Please note that getting and visualizing data from the service may take some time.
- If groups and groupings are used in the workspace, you can filter results by group.
- You can download or print the analytics pattern.
- You can use certain functions to send emails to students who are at risk of falling behind.
| Function | Purpose of use | Example |
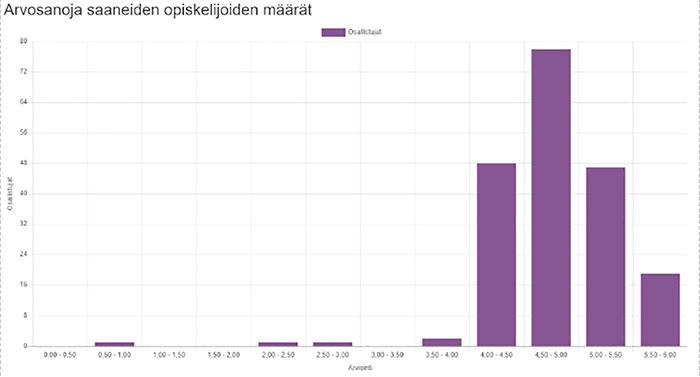
| Grades chart | Shows the percentage distribution of grades as an eye-catching graph.
You can choose which activity you want to see the ratings for. By clicking on the figure you can see more detailed information, e.g. how many students passed at any level. |
You can identify students who need improvement.
You can send an email message to students who received a certain grade, e.g. failed. |
| Content accesses | Shows the selected activity and/or material type and shows how many participants have opened the item as a graph.
You can choose from which day you want to view the information. |
You can monitor students’ activity, for example as support for guiding independent work.
By clicking on the yes/no bar, you can see the students’ names. You can send them an email. |
| Number of active students | Shows what time of day students are active in Moodle.
You can choose how many previous days to look at, starting from the implementation start date at the earliest. |
You can use it as an aid for planning the timing.
By clicking on the bar connected to the time, you can see the students’ names. You can send them an email. |
| Assignment submissions | Shows the statistics of the returns made during the entire implementation.
You can view on-time, late, missing returns and related ratios. |
You can see the status of returns at a glance. At the same time, you will get an overall picture of the timings and quantities of the implementation tasks.
By clicking on the different bars, you can see the students’ names. You can send them an email. |
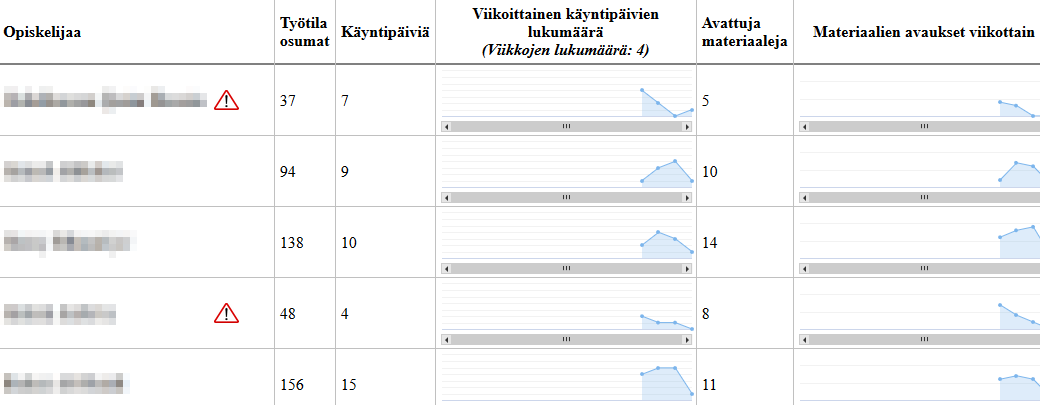
| Hits distribution | Shows each student’s activity on a weekly basis:
|
You can monitor the students’ activity during the implementation. From the view, you can identify students who are at risk of dropping out.
You can send an email to students who have never opened anything. |
Dedication tool
The tool measures the time the student has spent in the course area. You can adjust the time bracket according to which the operating time is viewed. The information gives direction, but it is influenced by, for example, whether the actual work takes place in Moodle or somewhere else.
Moodle quiz
A graph is created from the scores obtained from the quiz, from which the teacher can see a summary of the results. The diagram is the last on the quiz results page.