• Skip to primary navigation
  • Skip to main content
  • Skip to footer
HAMK - Häme University of Applied Sciences

Digipedagogical guidelines

  • Suomi
MENUMENU
  • Home
  • Planning
  • Teaching and guidance
  • Content production
  • Content sharing

Venngage – service to create infographics


Kuuntele

Venngage – service to create infographics

bannerikuva tyokaluja

Article sections


    Kuuntele

    Venngage is a service that makes it easy to create impressive infographics and other visual presentations such as reports, charts or advertisements. You can use existing themes, add predefined elements or your own images, and upload and share your output.
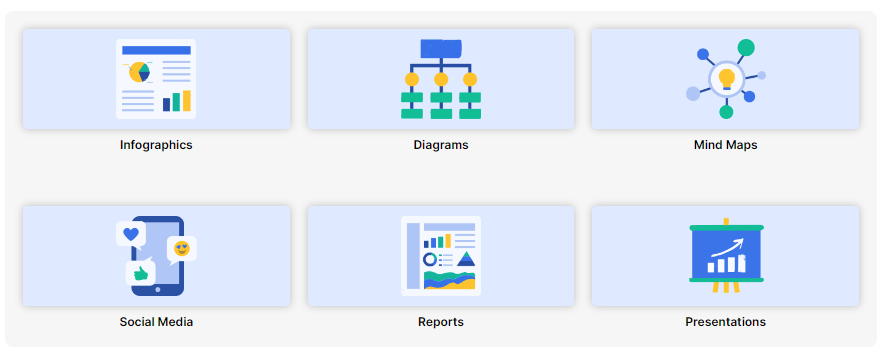
    A screenshot from Venngage, where you can find many ready-made options for templates, including infographics, diagrams, concept maps, social media, reports and presentations.

    Venngage has many ready-made templates that are easy to customise to suit your needs. To ensure the accessibility of your infographic, you can use the service’s accessibility tool and the ready-made accessible templates.

    The AI tools in Venngage help you create infographics and format text, for example.

    How to get Venngage user ID

    A member of HAMK staff can subscribe to the Venngage service by submitting a ticket via helpdesk.hamk.fi.

    Instructions for using Venngage

    All instructions are in English and will open in a new window.

    • Get started with Venngage
      • Guidance on making your first infographic: using and editing the finished theme, uploading and deleting the output
    • Create, edit and organize
      • Instructions on how to use Venngage tools and functionalities
    • Venngage Accessible Design Tool
    • Charts, tables, diagrams and data
    • Share your designs
    • Share, collaborate and comment
    • All instructions at Venngage Help Center.

    Open Badges

    Open Badges related to Venngage (in Finnish): Esitysgrafiikat ja infograafit. Read more at HAMK Intra (only for staff) Visualization Badge.

    Last Updated: 5 months ago
    in Tools for creating learning materials
    Tags: creating infographics, creating material, diagram, infographic, instructions venngage, learning materials, material, presentation, presentation slide, report, sharing material, vengage, venngage, visual presentation, visualisation, visuality, visuality
    Oliko artikkeli hyödyllinen?

    Related Articles

    • Installing Adobe software
    • ThingLink – Interactive learning experience
    • ThingLink as a part of a PowerPoint presentation
    • Adobe Express — Visual Content Effortlessly
    • ChatGPT, Gemini (Bard) and Edge Copilot (Bing AI Chat)

    Footer

    Häme University of Applied Sciences
    (HAMK) / PO Box 230 13101 Hämeenlinna Finland
    03 6461
    HAMK@HAMK.FI

    Privacy policy
    Cookies
    Takedown request
    Accessibility summary
    Site map

    cc-lisenssi

    This material is CC licensed Attribution-ShareAlike 4.0 International.

    Our site uses cookies to track the use of the site and to develop our service. You may decline or accept these cookies.AcceptDeclineMORE INFORMATION